
TL;DR:
- The cap rate measures a property’s income yield by dividing net operating income by its market value. It is a useful valuation tool but has limitations that require pairing with other metrics for full analysis. Investors must build their own NOI and assume conservative exit cap rates to accurately evaluate deals and manage risk.
The capitalization rate, universally known as the cap rate, is defined as a property’s net operating income (NOI) divided by its current market value or purchase price. For multifamily investors, cap rate explained multifamily style means this single ratio tells you how much income a property generates relative to what you pay for it, before any financing enters the picture. It is the most widely used valuation metric in commercial real estate, and understanding it correctly separates disciplined underwriting from guesswork. This guide covers the full calculation, 2026 market benchmarks by asset class, risk-return dynamics, and how cap rates fit into exit strategy modeling.
How is cap rate calculated for multifamily properties?
Cap rate is calculated by dividing NOI by the property’s purchase price or market value. The formula is straightforward: Cap Rate = NOI ÷ Property Value. The complexity lies in calculating NOI correctly.

NOI equals total rental income minus all operating expenses. Operating expenses include property taxes, insurance, property management fees, maintenance and repairs, and a vacancy allowance. Mortgage payments are excluded entirely. Cap rate is a pre-financing metric, so debt service never enters the NOI calculation.
Here is a step-by-step example for a 10-unit property in Massachusetts:
- Gross rental income: $180,000 per year ($1,500/unit/month × 10 units × 12 months)
- Vacancy allowance (5%): Subtract $9,000, leaving effective gross income of $171,000
- Operating expenses: Property taxes $18,000, insurance $6,000, management (8%) $13,680, maintenance $12,000, total $49,680
- NOI: $171,000 minus $49,680 equals $121,320
- Cap rate: $121,320 ÷ $1,500,000 purchase price = 8.09%
Forward NOI is commonly used for acquisition pricing rather than trailing historical figures. This reflects expected stabilized income, not last year’s actuals. If a property has deferred maintenance or below-market rents, trailing NOI will understate the true investment picture.
Pro Tip: Always build your own NOI model from rent rolls and actual expense records. Seller-provided pro formas routinely understate vacancy and management costs, which inflates the stated cap rate.
What are typical cap rate ranges for multifamily in 2026?
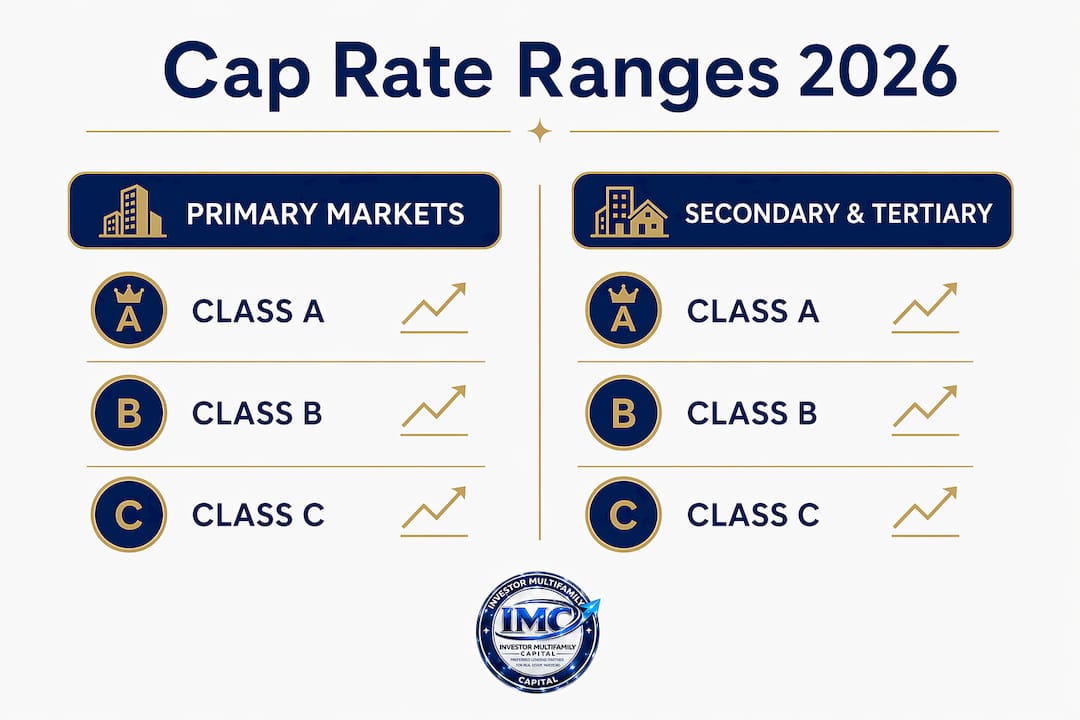
Multifamily cap rates in 2026 vary significantly by asset class and market tier. These benchmarks reflect current risk pricing and investor demand across the country.
| Asset Class | Primary Markets | Secondary Markets | Tertiary Markets |
|---|---|---|---|
| Class A | 4.5%–5.5% | 5.0%–6.0% | 5.5%–6.5% |
| Class B | 5.5%–6.5% | 6.0%–7.0% | 6.5%–7.5% |
| Class C | 7.0%–8.0% | 7.5%–8.5% | 8.5%–9.0%+ |
Class A properties in primary markets like Boston, Miami, or New York trade at the lowest cap rates because demand is highest and risk is lowest. Investors accept compressed yields in exchange for stability, liquidity, and institutional-grade tenants.
Class B and Class C properties in secondary and tertiary markets offer higher cap rates. That premium compensates for factors like:
- Higher tenant turnover and collection risk
- Greater deferred maintenance exposure
- Thinner buyer pools at exit
- More active management requirements
- Weaker rent growth fundamentals
New England markets, including Massachusetts and Connecticut, generally track primary market cap rates for Class A and B assets. Investors evaluating deals in these states should use the primary market column as their baseline. Understanding multifamily property classification directly affects which benchmark applies to your deal.
What does a cap rate tell you about risk and return?
Cap rate is a risk-adjusted yield measure, not a profitability score. Higher cap rates signal higher risk, including issues like deferred maintenance, management intensity, or weaker locations. Lower cap rates indicate stable, lower-risk assets where investors compete aggressively for deals.
“Cap rate is not inherently ‘better’ when higher. A 9% cap rate on a Class C property in a tertiary market may represent far more risk and operational burden than a 5% cap rate on a stabilized Class A asset in a supply-constrained metro. The number only makes sense in context.”
The relationship between cap rates and borrowing costs matters enormously for leverage decisions. Cap rate spread versus borrowing costs determines whether debt amplifies or erodes returns. When a property’s cap rate exceeds the interest rate on the loan, leverage works in the investor’s favor. When borrowing costs exceed the cap rate, every dollar of debt reduces overall returns.
Cap rate also has real limitations investors must respect:
- It ignores financing structure entirely
- It does not capture rent growth or appreciation potential
- It cannot compare assets across different property types or geographies without adjustment
- It reflects a single point in time, not a multi-year investment thesis
Cap rate is a valuation snapshot, not a complete performance metric. Pairing it with cash-on-cash return, DSCR, and IRR gives a full picture of deal viability. Investors who rely on cap rate alone routinely miss deals where strong rent growth justifies a compressed entry yield, and they overpay for deals where a high cap rate masks serious operational problems.
Pro Tip: When evaluating a deal with a cap rate near your borrowing cost, model a scenario where rates rise 50 basis points. If the deal breaks, the margin of safety is too thin.
How should investors use cap rates in underwriting and exit strategy?
Cap rate serves two functions in multifamily underwriting: validating the purchase price and stress-testing the exit. Both require discipline.
To validate a purchase price, divide your stabilized NOI by the market cap rate for that asset class and location. The result is the implied market value. If the seller’s asking price exceeds that figure, you are either paying for future upside or overpaying outright.
For exit strategy modeling, follow this sequence:
- Establish entry cap rate: Calculate based on your purchase price and stabilized NOI.
- Set exit cap rate assumption: Always underwrite the exit at a higher cap rate than entry. A 25–50 basis point buffer is standard conservative practice.
- Model NOI growth: Project rent increases and expense changes over the hold period.
- Calculate exit value: Divide projected exit-year NOI by the exit cap rate.
- Run IRR and cash-on-cash: Layer in financing costs, capital expenditures, and sale proceeds.
Buying at a 5% cap and modeling a 5% exit is optimistic and creates real value contraction risk if market cap rates rise. Underwriting a higher exit cap rate forces the deal to prove itself on NOI growth, not market compression.
The table below shows how a cap rate shift at exit affects value on a property with $500,000 NOI:
| Exit Cap Rate | Implied Exit Value | Change from 5.0% Entry |
|---|---|---|
| 4.5% | $11,111,111 | +$1,111,111 |
| 5.0% | $10,000,000 | Flat |
| 5.5% | $9,090,909 | -$909,091 |
| 6.0% | $8,333,333 | -$1,666,667 |
A half-point cap rate expansion at exit destroys nearly $1,000,000 in value on a $10,000,000 asset. This is why conservative deal underwriting always builds in exit cap rate cushion. Pair this analysis with DSCR calculations to confirm the deal services debt at every stage of the hold.
Cap rate also connects directly to key investment metrics like cash-on-cash return and IRR. Cap rate sets the valuation baseline. Financing terms then determine how much of that yield the investor actually captures after debt service.
Key Takeaways
The cap rate formula divides NOI by property value, and every multifamily investor must understand both the calculation and its limits before committing capital to a deal.
| Point | Details |
|---|---|
| Cap rate formula | NOI divided by purchase price; excludes mortgage payments entirely. |
| 2026 benchmarks | Class A trades at 4.5%–5.5% in primary markets; Class C reaches 9.0%+ in tertiary markets. |
| Risk-return relationship | Higher cap rates signal higher risk, not better deals; context determines value. |
| Exit cap rate discipline | Always underwrite exit at a higher cap rate than entry to hedge against market shifts. |
| Cap rate limitations | Use alongside DSCR, cash-on-cash return, and IRR for complete deal evaluation. |
Why I stopped trusting cap rates at face value
I have reviewed hundreds of multifamily deals across New England and Florida, and the single most common mistake I see is investors treating a seller’s stated cap rate as a starting point for analysis. It should be the end point of your own independent calculation.
Sellers routinely present pro formas with 3% vacancy on properties that have run 8% vacancy for three years. Management fees get omitted. Capital reserve lines disappear. The result is an inflated NOI and a compressed cap rate that makes the deal look tighter and safer than it actually is.
The second mistake is using cap rate as the only filter. I have seen investors pass on deals with 5% cap rates in supply-constrained Boston suburbs because the number looked thin, only to watch those properties appreciate 20% over three years on rent growth alone. Cap rate is a snapshot. It does not tell you where rents are going or what the market will pay at exit.
My rule: build your own NOI from actual rent rolls and trailing 12-month expense statements. Then underwrite your exit at a cap rate 50 basis points higher than your entry. If the deal still pencils on IRR and cash-on-cash, you have a real deal. If it only works assuming cap rate compression, walk away.
— Joe
Financing multifamily deals with cap rate-aware underwriting
Investor MultiFamily Capital finances multifamily acquisitions across New England and Florida with underwriting built around real cash flow, not optimistic pro formas. If your deal analysis starts with a solid cap rate calculation and a conservative exit assumption, the financing conversation becomes straightforward.

Investor MultiFamily Capital offers multifamily financing solutions for 5+ unit properties, with loan structures designed to match your hold period and business plan. Whether you are acquiring a stabilized Class B asset in Massachusetts or repositioning a Class C property in Florida, the team underwrites based on property cash flow, not personal income. Submit a Deal or Run Deal Analysis to get a fast read on your scenario.
FAQ
What is cap rate in multifamily real estate?
Cap rate is net operating income divided by the property’s purchase price or market value. It measures a property’s income yield before financing costs.
What is a good cap rate for multifamily in 2026?
A good cap rate depends on asset class and market. Class A properties in primary markets trade at 4.5%–5.5%, while Class C assets in tertiary markets reach 7.0%–9.0%+.
Does cap rate include mortgage payments?
No. Cap rate is a pre-financing metric. NOI excludes debt service, which is why cap rate must be paired with DSCR and cash-on-cash return for full deal analysis.
Why should I underwrite a higher exit cap rate than my entry cap rate?
Underwriting a higher exit cap rate hedges against market shifts. If cap rates rise after purchase, property values decline even when income holds steady, so conservative exit assumptions protect your IRR.
What are the limitations of using cap rate alone?
Cap rate does not capture financing structure, rent growth, or future market conditions. Investors must combine it with DSCR, IRR, and cash-on-cash return for a complete picture of deal performance.
Investor-only. Business-purpose investment property financing only. Not for owner-occupied or primary residence loans.
Recommended
- Investor Financing Insights | Investor MultiFamily Capital Blog
- What Counts as Multifamily Property: 2026 Investor Guide | Investor MultiFamily Capital
- What Is Multifamily Financing? A 2026 Investor Guide | Investor MultiFamily Capital
- How to Finance a 5+ Unit Multifamily Property in 2026 | Investor MultiFamily Capital