Leverage in multifamily real estate is the use of borrowed capital to control larger property assets than equity alone would allow, amplifying both potential returns and investment risk. For investors in New England and Florida markets, understanding why leverage matters in multifamily is the difference between scaling a portfolio efficiently and overextending into deals that underperform. The mechanics are precise: borrow at a cost below your property’s return, and leverage works in your favor. Borrow above it, and every dollar of debt erodes equity returns. This article breaks down how leverage functions, where it creates value, and where it destroys it.
Why leverage matters in multifamily real estate
Leverage, in standard real estate finance terminology called financial leverage, is the ratio of total asset value to equity invested. At a 65% loan-to-value (LTV) ratio, an investor controls $1 million in property with $350,000 of equity. The leverage ratio at that LTV is 2.86x, meaning every percentage point of property return translates into a 2.86x amplified return on equity. That math is why the importance of leverage in multifamily is so consistently cited by experienced investors.
The relationship between LTV and leverage ratio follows a direct formula: LR = 1/(1 – LTV). Typical stabilized multifamily LTV ranges from 60% to 75%, producing leverage ratios between 2.5x and 4x. That range defines the normal operating band for most multifamily financing strategies. Staying within it keeps debt manageable while still amplifying equity returns meaningfully.
Leverage does not create value on its own. It redistributes risk from the lender to the equity investor. The additional equity return from leverage is compensation for the increased risk borne by the equity position, not free profit. Investors who treat leverage as a return enhancer without accounting for the corresponding risk exposure consistently underwrite deals that fail under stress.

How leverage ratios translate to return ranges
The clearest way to see leverage at work is through return range analysis. At 65% LTV with a leverage ratio of 2.86x, the equity return range spans roughly 63 percentage points versus 22 percentage points for an unlevered position. That wider range means higher upside in favorable conditions and deeper losses when property performance falls short.
| Scenario | LTV | Leverage Ratio | Equity Return Range |
|---|---|---|---|
| Unlevered | 0% | 1.0x | ~22 percentage points |
| Moderate leverage | 65% | 2.86x | ~63 percentage points |
| High leverage | 75% | 4.0x | Wider still |
Pro Tip: Run your return scenarios at both the base case and a 10% NOI haircut before committing to any leverage ratio. The downside range at 75% LTV is not proportionally larger than at 65% LTV. It is dramatically larger.
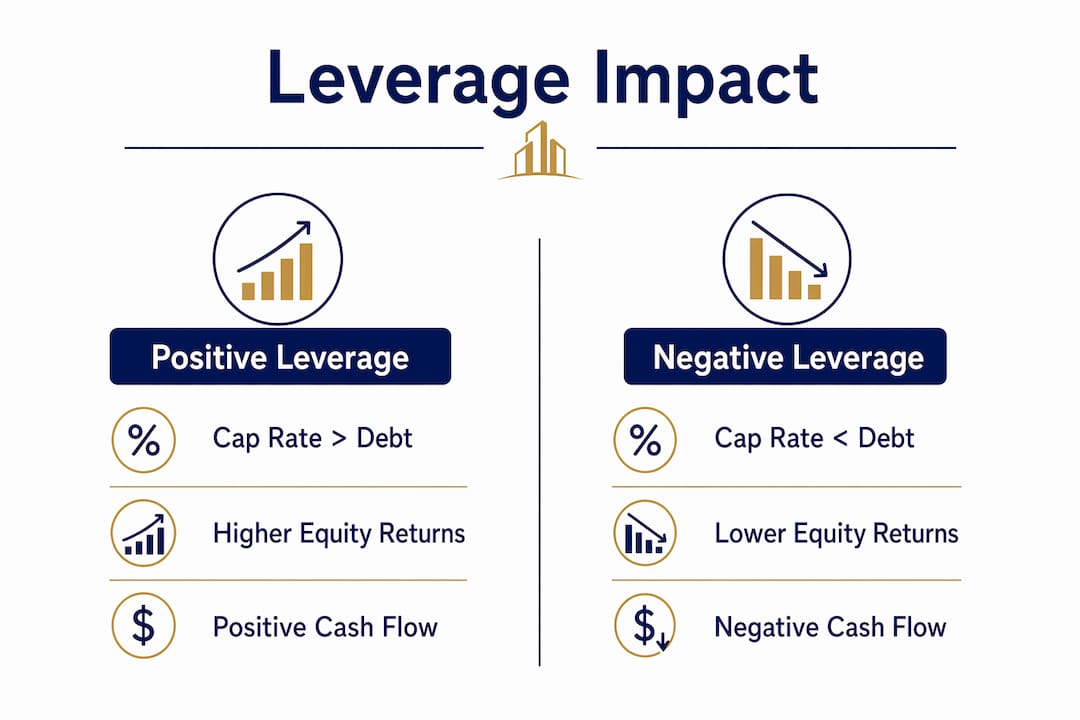
What is positive vs. negative leverage in multifamily?
Positive leverage exists when a property’s capitalization rate exceeds the cost of debt. Negative leverage is the opposite: the loan coupon exceeds the cap rate, meaning debt costs more than the property earns on a per-dollar basis. This distinction is the most critical concept in multifamily deal underwriting today.
In 2026, multifamily cap rates sit 57 basis points below loan coupons in CMBS transactions, confirming that negative leverage is the prevailing condition across most multifamily markets. That gap means investors who buy at current pricing are accepting day-one cash flow dilution in exchange for anticipated NOI growth and eventual refinancing relief.
The practical implications of negative leverage are significant:
- Cash flow compression. Debt service consumes a larger share of NOI, reducing distributable cash flow to equity from day one.
- Refinancing dependency. Deals underwritten in negative leverage conditions often depend on rate normalization or NOI growth to achieve target returns. Most 2026 originations are structured around forward NOI growth rather than current accretive cash flows.
- Stress test requirements. Lenders and equity partners now require conservative NOI sustainability analysis and a credible refinancing strategy before committing capital.
- Exit price sensitivity. If cap rates compress as expected, the exit valuation improves. If they do not, the deal’s return profile deteriorates sharply.
Positive vs. negative leverage at a glance
| Condition | Cap Rate vs. Debt Cost | Equity Return Impact | Cash Flow Day One |
|---|---|---|---|
| Positive leverage | Cap rate > loan coupon | Amplified above unlevered | Accretive |
| Negative leverage | Cap rate < loan coupon | Diluted below unlevered | Compressed |
Negative leverage is not automatically a deal killer. It requires a credible path to positive leverage through NOI growth, expense reduction, or rate improvement. Without that path, the deal is speculative rather than investment-grade.
How does debt structure affect cash flow durability?
The type of loan you use matters as much as the LTV you choose. Fixed-rate loans lock in debt service costs, protecting cash flow if rates rise further. Adjustable-rate or bridge loans carry lower initial costs but introduce refinancing risk at maturity. Transactions supported by assumable loans with remaining term consistently show stronger pricing and execution certainty because buyers inherit favorable debt rather than facing current market rates.
For value-add deals in markets like Massachusetts, Connecticut, or Florida, the financing structure directly determines whether a business plan is executable. Consider these structural factors before committing to a loan:
- Fixed vs. floating rate. Fixed-rate agency debt from Fannie Mae or Freddie Mac provides payment certainty over a 10-year term. Bridge loans from private lenders offer speed and flexibility but require a clear exit or refinance plan within 24 to 36 months.
- Interest-only periods. IO periods reduce early debt service, preserving cash flow during lease-up or renovation. They are common in bridge and DSCR loan structures.
- Prepayment penalties. Yield maintenance and step-down prepayment provisions on agency loans can make early exits expensive. Model the full exit cost before assuming a short hold period.
- DSCR requirements. Most lenders require a minimum debt-service coverage ratio of 1.20x to 1.25x at stabilization. Deals underwritten below that threshold face refinancing risk at maturity.
Pro Tip: On value-add deals, model your DSCR at both current rents and projected stabilized rents. If the deal only works at stabilized rents, you are carrying execution risk that the debt structure must accommodate, not ignore.
Investormultifamily structures multifamily financing around property cash flow rather than personal income, which means the DSCR calculation is central to every deal review. That approach aligns loan sizing with actual property performance, reducing the risk of overleveraging relative to income.
Why leverage matters strategically for building multifamily wealth
The advantages of leverage in multifamily extend well beyond simple return amplification. Used with discipline, financial leverage enables four distinct wealth-building mechanisms simultaneously.
-
NOI improvements translate directly into property value. Multifamily value equals NOI divided by cap rate. A $50,000 annual NOI improvement at a 5.5% cap rate adds $909,000 in property value. With leverage, that value gain accrues entirely to the equity position, which may represent only 30% to 40% of total capitalization. The return on equity from operational improvement is therefore 2.5x to 3x the unlevered gain.
-
Tax benefits compound with leverage. Depreciation deductions, bonus depreciation under current tax code provisions, and interest expense deductions all reduce taxable income. Multifamily properties generate income and equity build while taking advantage of tax incentives that further enhance after-tax investor returns. Leverage amplifies the asset base against which these deductions apply.
-
Portfolio scaling becomes possible with less capital. Controlling $5 million in multifamily assets with $1.75 million in equity at 65% LTV frees the remaining capital for additional acquisitions. Without leverage, the same $1.75 million controls only $1.75 million in assets. The difference in portfolio scale over a 10-year hold period is substantial.
-
Inflation hedging is built into the structure. Fixed-rate debt locks in today’s borrowing costs while rents and property values adjust upward with inflation. The real cost of debt declines over time as NOI grows, converting what may start as neutral or negative leverage into positive leverage as the hold period progresses.
-
Principal paydown builds equity passively. Every mortgage payment reduces the outstanding loan balance, increasing equity without additional capital contribution. At 65% LTV on a 30-year amortizing loan, a meaningful portion of each payment reduces principal from year one, accelerating equity accumulation.
Aligning these mechanisms requires realistic underwriting. Investors who project aggressive rent growth to justify current pricing without stress-testing that growth assumption are not using leverage strategically. They are using it speculatively.
Key takeaways
Leverage in multifamily real estate amplifies equity returns proportionally to the leverage ratio, but only when property returns exceed debt costs. Negative leverage, which is the current condition in most 2026 CMBS markets, requires a credible NOI growth or refinancing path to justify the risk.
| Point | Details |
|---|---|
| Leverage ratio mechanics | LTV of 65% produces a 2.86x leverage ratio, widening the equity return range dramatically. |
| Positive vs. negative leverage | Cap rates below loan coupons compress cash flow and require forward NOI growth to generate target returns. |
| Debt structure matters | Fixed-rate and assumable loans provide cash flow durability; bridge loans require a clear exit plan. |
| NOI drives value creation | A $50,000 NOI gain at a 5.5% cap rate adds over $900,000 in property value, amplified through leverage. |
| Stress testing is required | Leverage is a risk-return tool, not a return guarantee. Every deal needs downside scenario analysis. |
My view on using leverage wisely in 2026
I have reviewed enough multifamily deals to say this plainly: most investors underestimate how much the current rate environment has changed the leverage calculus. The deals that worked at 4% debt costs in 2021 do not automatically work at 6.5% to 7% today. The math is different. The margin for error is smaller.
What I see consistently is investors anchoring to the leverage ratio they want rather than the leverage ratio the deal supports. They start with a target LTV and work backward to justify it. That is the wrong sequence. Start with the property’s current and realistic forward NOI, determine what debt service that NOI can support at a 1.25x DSCR, and let that number set your maximum loan size. The LTV follows from the deal. The deal does not follow from the LTV.
The loan-level leverage-spread discipline that separates strong multifamily operators from distressed ones is not glamorous. It is the willingness to walk away from deals where the debt cost exceeds the property’s earning power without a credible operational plan to close that gap. Negative leverage is manageable with the right business plan. It is not manageable with optimism alone.
Leverage for property investments remains one of the most powerful tools available to multifamily investors. The investors who use it well treat it as a deliberate risk-return decision, not a default setting. They stress test their assumptions, match their loan structure to their hold period, and size their debt to what the property actually earns. That discipline is what separates a portfolio that compounds over a decade from one that stalls at the first refinancing cycle.
— Joe
Financing structures built for multifamily leverage strategies
Investormultifamily provides business-purpose financing designed specifically for real estate investors who need debt structures aligned with their multifamily investment strategy. Whether you are acquiring a stabilized asset, executing a value-add plan, or refinancing into long-term fixed-rate debt, the right loan structure determines whether your leverage works for you or against you.
Investormultifamily offers DSCR loans sized to property cash flow, bridge loans for transitional assets, and dedicated multifamily loan programs across Massachusetts, New Hampshire, Rhode Island, Connecticut, Maine, and Florida. Loan approval is based on property performance, not personal income. Submit your deal scenario and get a financing structure that matches your leverage strategy.
FAQ
What does leverage mean in multifamily real estate?
Leverage in multifamily real estate means using borrowed capital to control a larger asset than equity alone would allow. At 65% LTV, an investor controls $1 million in property with $350,000 in equity, producing a leverage ratio of 2.86x.
What is the difference between positive and negative leverage?
Positive leverage occurs when a property’s cap rate exceeds the loan coupon, amplifying equity returns above the unlevered rate. Negative leverage is the reverse: the debt cost exceeds the cap rate, compressing equity returns below what an all-cash purchase would generate.
Is negative leverage always a bad sign for a multifamily deal?
Negative leverage is not automatically disqualifying, but it requires a documented path to NOI growth or rate improvement to justify the risk. Most 2026 multifamily originations are underwritten on forward NOI growth rather than day-one accretive cash flows.
What LTV ratio is typical for multifamily financing?
Stabilized multifamily properties typically support LTV ratios between 60% and 75%, translating to leverage ratios of 2.5x to 4x. The appropriate LTV depends on the property’s DSCR, the loan type, and the investor’s hold period and exit strategy.
How does leverage affect multifamily property value?
Leverage amplifies the equity impact of NOI improvements because multifamily value is calculated as NOI divided by cap rate. A $50,000 NOI gain at a 5.5% cap rate adds over $900,000 in property value, and that entire gain accrues to the equity position regardless of how much debt is on the asset.